
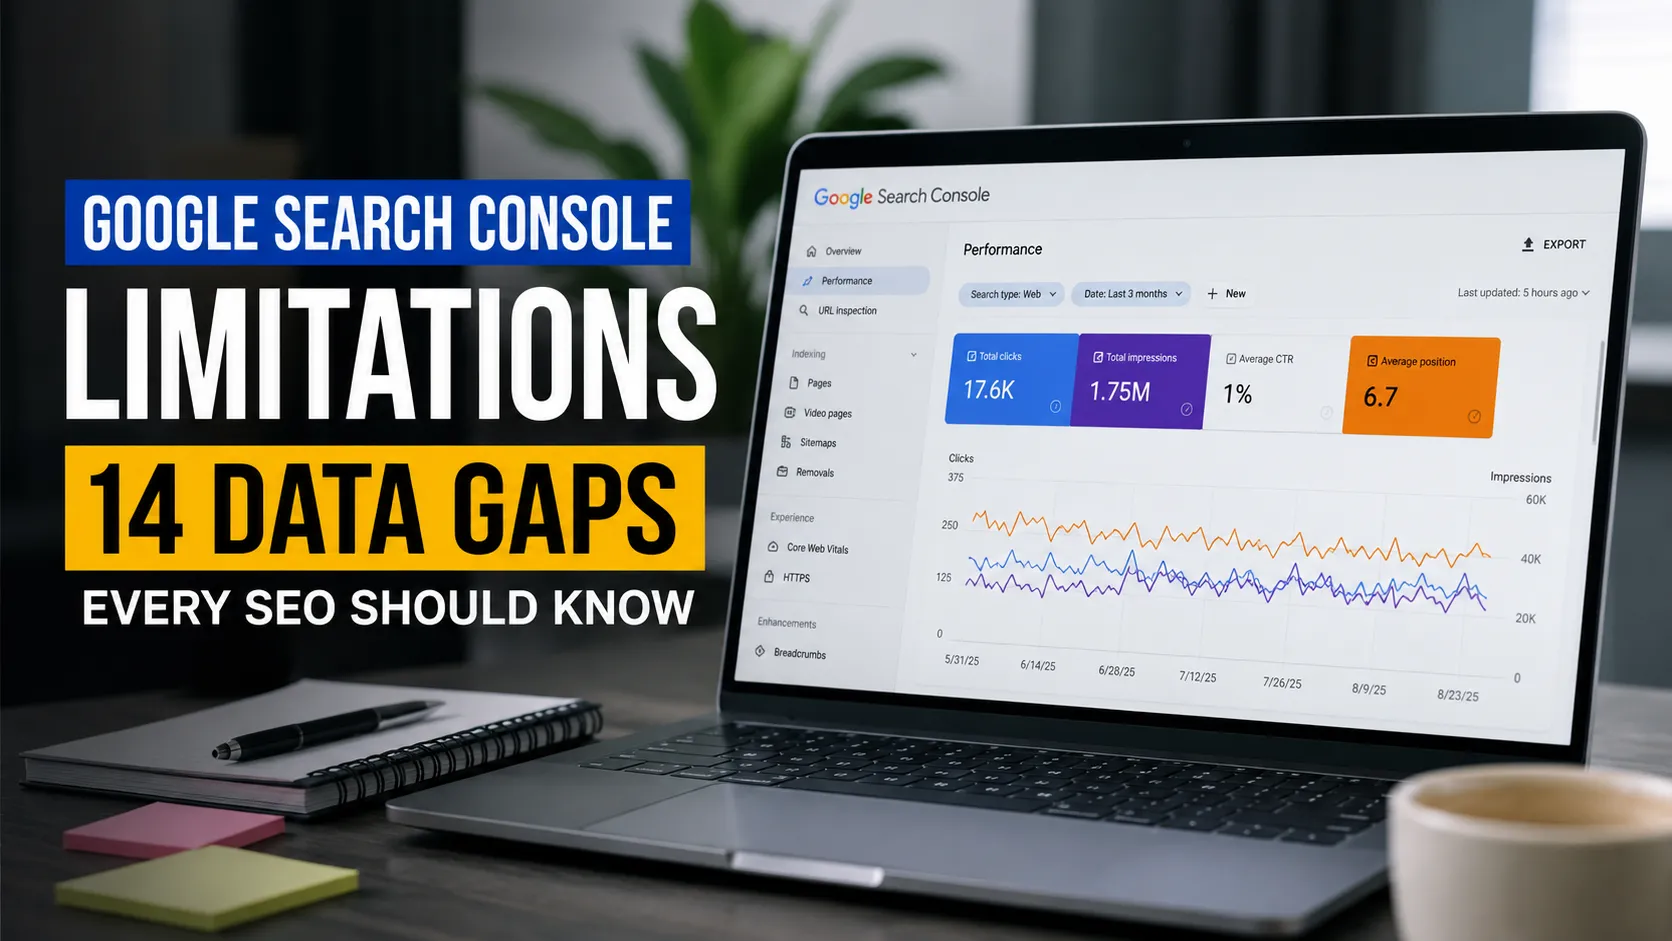
Google Search Console is the closest thing SEOs have to a direct line into Google’s data. It’s free, it’s first-party, and it’s the only tool that shows you actual impressions and clicks from real search queries.
But it’s also incomplete — by design.
Over the past few years of running technical SEO audits for clients, I’ve seen the same pattern repeat: decisions made on GSC data that looked solid, but were built on a partial picture. A client panics because impressions dropped 40%, when the real cause was a reporting change on Google’s end. Another client ignores an entire cluster of long-tail queries because GSC never surfaced them.
The tool is not broken. But if you don’t understand where the data stops, you’ll draw the wrong conclusions from it.
This article documents every confirmed limitation of Google Search Console’s performance data — what each one means in practice, and how to work around it.
- 1. The 1,000-Row UI Limit
- 2. The API Row Limit: 50,000 Per Search Type, Per Day
- 3. Anonymized Queries: The Biggest Hidden Data Gap
- 4. The Impression Requirement: No Impression Means No Data
- 5. Average Position Is Not Your Rank
- 6. Chart and Table Show Different Numbers
- 7. Data Retention: 16 Months, Then Permanently Deleted
- 8. Data Freshness: 2–4 Days Behind, Sometimes Weeks
- 9. Google Search Only — No Other Search Engines
- 10. GSC Clicks and GA4 Sessions Will Never Match
- 11. Canonicalization Hides Your Page-Level Data
- 12. The num=100 Removal Changed Your Historical Data
- 13. AI Overviews Distort Impressions and CTR
- 14. BigQuery Bulk Data Export: The Unlimited Option (With Caveats)
- Frequently Asked Questions
1. The 1,000-Row UI Limit
The Google Search Console interface caps every report at 1,000 rows. This applies to queries, pages, countries, devices, and search appearances — all of them.
If you export the data to CSV or Google Sheets, the same 1,000-row cap applies. The export mirrors what the UI shows, nothing more.
The rows are sorted by clicks (then impressions) by default. The sorting you see in the UI happens client-side — meaning it only rearranges the same 1,000 rows that were already loaded. You cannot sort your way to row 1,001.
What this means in practice: If your site ranks for 15,000 queries in a given period, you’re seeing roughly 6-7% of your keyword data. Every long-tail query that generated a few clicks but didn’t make the top 1,000 by click volume is invisible to you.
The workaround: Use the Search Console API (covered in the next section), Looker Studio with a GSC connector, or BigQuery Bulk Data Export for the full dataset.
2. The API Row Limit: 50,000 Per Search Type, Per Day
The GSC API returns a maximum of 25,000 rows per request. You can paginate using the startRow parameter to retrieve more data, but there’s a hard ceiling: 50,000 rows per search type per day.
Search types (web, image, video, news) are counted separately. So you could theoretically pull 50,000 web rows and 50,000 image rows in the same day, but you cannot exceed 50,000 within a single type.
The API returns the top rows sorted by clicks, just like the UI. If your site has 200,000 unique query/page/device/country combinations for a given day, only the top 50,000 by clicks are exposed. The rest are silently dropped.
What this means in practice: For small to mid-size sites, the API limit rarely matters — most sites have fewer than 50,000 daily combinations. For enterprise sites with hundreds of thousands of pages, you could be missing the majority of your search data even through the API.
The workaround: BigQuery Bulk Data Export is the only option that removes this cap entirely. More on that in section 14.
3. Anonymized Queries: The Biggest Hidden Data Gap
This is the limitation that causes the most confusion — and the most bad decisions.
Google strips out queries that were searched by too few people (roughly fewer than a few dozen users over a two-to-three month window). These are called “anonymized queries.” The clicks and impressions from these queries still count in your site-level and page-level totals, but you will never see the actual search terms.
On some sites, anonymized queries account for up to 50% of total clicks.
That’s not a typo. Google’s own documentation confirms that the sum of clicks from all visible queries in the table will almost never equal the total clicks shown in the chart above it. The difference is anonymized queries.
What this means in practice: If your GSC table shows 600 clicks across all visible queries, but your chart total shows 1,000 clicks, those 400 missing clicks came from queries Google won’t reveal to you. You cannot filter your way to them. You cannot find them through the API. You cannot recover them through BigQuery Bulk Data Export — even the bulk export marks these as is_anonymized_query = true and returns null for the query field.
The workaround: There is no way to recover the actual query text. The best approach is to use page-level data (which includes all clicks, anonymized or not) as your source of truth for traffic volume, and treat the query-level data as a directional sample of intent rather than a complete inventory.
4. The Impression Requirement: No Impression Means No Data
Google Search Console only records data for a query if your site earned at least one impression for it. An impression means your URL appeared in a search result that was loaded by a real user.
If your page is technically indexed and ranking at position 95 for a query, but no user ever loads the search result page where your link appears, that query will never show up in your GSC data. As far as GSC is concerned, it doesn’t exist.
What this means in practice: You could rank for thousands of queries that GSC has zero record of — simply because nobody scrolled deep enough (or loaded enough results pages) to trigger an impression for your result. This is especially common for queries where your site ranks beyond position 20.
This limitation became more significant after Google removed the &num=100 parameter in late 2026 (covered in section 12). Before that removal, third-party rank-tracking tools were loading 100 results per query, which generated impressions for deep-ranking results. With the parameter gone, those artificial impressions disappeared, and deep-position keywords largely vanished from GSC data.
The workaround: Use third-party rank tracking tools (Ahrefs, Semrush, etc.) to find queries where your site ranks but GSC shows no data. Cross-reference with GSC to build a more complete picture.
5. Average Position Is Not Your Rank
The “Average Position” metric in GSC is an impression-weighted average across all appearances during the selected time period. It is not a snapshot of where your page currently ranks.
If your page appeared at position 3 for a query on five occasions, and at position 85 for the same query on one occasion, the average position reflects a weighted blend of all six impressions. The result might show as position 16 — a number that doesn’t represent any actual ranking your page ever held.
Position is also calculated per impression, not per day. If your page appeared twice in the same day at different positions (for example, in a standard blue link and in a featured snippet), both appearances contribute separately to the average.
What this means in practice: A page showing “average position 12” in GSC might actually rank #3 for 90% of impressions and #90 for 10% — the average is mathematically correct but practically misleading. Never use average position as a substitute for rank tracking.
The workaround: Filter by specific date ranges to reduce variability. Use third-party rank trackers for point-in-time position snapshots. When analyzing GSC position data, always look at it alongside impression and click volume for context.
6. Chart and Table Show Different Numbers
The chart at the top of the GSC Performance report and the data table below it do not show the same data.
When no filters are applied, the chart totals include all clicks and impressions — including those from anonymized queries. The table, however, only shows rows for non-anonymized queries. This means the chart total will almost always be higher than the sum of all rows in the table.
The gap widens further when you apply any filter. As soon as you filter by a specific query (or “queries containing” / “queries not containing”), all anonymized query data is excluded from both the chart and the table. The totals drop, sometimes dramatically.
Google also uses two different aggregation methods: property-level and page-level. When you view the report without any page filter, data is aggregated at the property level. When you add a page filter, the aggregation switches to page-level, which can produce different numbers for the same time period.
What this means in practice: Comparing filtered and unfiltered views side by side will produce mismatched totals. This is not a bug — it’s how the system is designed. But it regularly causes confusion in client reporting, especially when different team members pull numbers with different filters applied.
The workaround: Always note whether your report is filtered or unfiltered when recording metrics. Use unfiltered chart totals for site-wide trends. Use filtered table data for query-level analysis, but acknowledge the gap.
7. Data Retention: 16 Months, Then Permanently Deleted
Google Search Console retains performance data for a maximum of 16 months. Once data passes that window, it is permanently deleted. There is no archive, no recovery option, and no way to request it from Google.
The 16-month window is rolling: every day, you gain one new day of data and lose one old day. If you need year-over-year comparisons beyond 16 months, the data must be exported before it expires.
What this means in practice: If you set up BigQuery Bulk Data Export today, it only captures data going forward from the moment of setup. It cannot reach back and pull the historical data that’s still within the 16-month window. Any data you didn’t export before it aged out is gone.
The workaround: Set up BigQuery Bulk Data Export immediately — even if you don’t plan to use it yet. The data starts accumulating from day one. Alternatively, use third-party tools that warehouse your GSC data (SEOTesting, SEO Stack, etc.), or schedule manual exports on a monthly cadence.
8. Data Freshness: 2–4 Days Behind, Sometimes Weeks
Google Search Console is not a real-time reporting tool. Standard performance data takes 2–4 days to appear.
The 24-hour tab (introduced as a “fresh data” view) uses a separate, experimental data pipeline that is faster but frequently unreliable. During Google backend updates, this tab can show zero data for hours or days — creating the false impression that your site lost all traffic.
Beyond the standard delay, Google has experienced multiple extended reporting outages: in October 2025, December 2025, and June 2026, data freshness delays stretched to multiple weeks. During these periods, the Performance report and the Page Indexing report showed stale data that was days or weeks old, with no way for users to force an update.
What this means in practice: You cannot use GSC to measure the impact of changes made yesterday. If you publish a new page or deploy a technical fix, you won’t see the results in GSC for at least 2–3 days, and possibly longer during reporting delays.
The workaround: Use Google Analytics 4 for near-real-time traffic monitoring. Use GSC for trend analysis over weeks and months, not for day-to-day tactical decisions. During known reporting delays, check Google’s Data Anomalies page in Search Console for official status updates.
9. Google Search Only — No Other Search Engines
GSC only tracks performance data from Google Search. It has zero visibility into Bing, DuckDuckGo, Yahoo, Yandex, Baidu, or any other search engine.
Depending on your audience and geography, non-Google search engines can account for 5–15% or more of total search traffic. GSC treats that traffic as if it doesn’t exist.
What this means in practice: If you’re reporting “organic search performance” using only GSC data, you’re undercounting. For sites with significant Bing traffic (common in B2B and enterprise audiences), the gap can be material.
The workaround: Use Bing Webmaster Tools for Bing-specific data (which also covers Yahoo and DuckDuckGo in many markets). Use Google Analytics 4 to see organic traffic from all search engines in a single view.
10. GSC Clicks and GA4 Sessions Will Never Match
GSC clicks and Google Analytics 4 organic sessions measure different things, using different methods, at different points in the user journey. They will never produce the same number.
GSC counts a click when a user clicks a search result pointing to your site. GA4 counts an organic session when the user’s browser loads your page and the GA4 tracking script fires. Several things can break the chain between those two events: the user bounces before the page loads, JavaScript fails to execute, the user has an ad blocker or tracking blocker enabled, or the page redirects through an intermediate URL.
GA4 also applies its own session logic (grouping multiple page views within a time window) and deduplicates sessions differently than GSC deduplicates clicks.
What this means in practice: It’s normal for GSC to show 15–30% more clicks than GA4 shows organic sessions. The gap varies by site speed, audience (tech-savvy audiences use more ad blockers), and mobile vs. desktop split. If the gap suddenly changes, investigate — but don’t try to make the numbers match.
The workaround: Use GSC as your source of truth for search performance (impressions, CTR, position). Use GA4 as your source of truth for on-site behavior (sessions, engagement, conversions). Don’t combine them into a single number.
11. Canonicalization Hides Your Page-Level Data
GSC aggregates performance data under the canonical URL — not necessarily the URL that actually appeared in search results.
If Google selects a different canonical than the one you intended (a common occurrence with duplicate content, parameter URLs, or HTTP/HTTPS variants), the clicks and impressions end up under the URL Google considers canonical. Your intended page may show zero data in GSC, even though it was the one that actually ranked and received clicks.
What this means in practice: If you’re filtering GSC by a specific page URL and seeing no data, it might not mean the page isn’t ranking. The data could be aggregated under a different URL that Google selected as the canonical. This is especially common on e-commerce sites with faceted navigation and on sites with both www and non-www versions.
The workaround: Use the URL Inspection tool to check which URL Google considers canonical for a given page. If it differs from your intended canonical, fix the canonical signal (via rel=canonical, redirects, or internal linking). Use Domain properties in GSC instead of URL-prefix properties to reduce canonicalization splitting.
12. The num=100 Removal Changed Your Historical Data
In late 2026, Google removed support for the &num=100 parameter — a URL parameter that allowed users (and, critically, automated rank-tracking tools) to load up to 100 search results per page instead of the default 10.
Third-party rank trackers had been using this parameter for years. Every time a rank tracker loaded 100 results for a query, Google counted it as impressions for all the sites appearing in those results — including sites ranking at positions 20, 50, or 90. These tool-generated impressions inflated GSC data across the board.
When Google removed the parameter, the inflated impressions disappeared. According to an analysis of 319 GSC properties, 87.7% of sites saw impression declines, and 77.6% lost unique ranking terms from their reports.
What this means in practice: If you’re comparing your 2026 GSC data to pre-removal data (before late 2026), the comparison is flawed. The drop in impressions and query count isn’t a performance decline — it’s a measurement correction. Your rankings didn’t change; the reporting did.
Positions beyond approximately 20 now show significantly less data than before, because real users rarely load that many results. Deep-position keywords that used to appear in GSC (because rank trackers generated impressions for them) are now largely invisible.
The workaround: Treat the post-removal data as your new baseline. Do not compare current impression numbers to pre-removal numbers for trend analysis. If you need to establish a clean comparison window, use data from January 2026 onward as your starting point.
13. AI Overviews Distort Impressions and CTR
When Google’s AI Overview feature displays content from your site within a generated answer at the top of the search results, GSC can count it as an impression. But users viewing the AI Overview rarely click through to the source page.
The result: your impression count inflates (because your site is technically “appearing” in results), but your click count stays flat or declines (because users get the answer from the AI Overview without visiting your site). Your CTR drops — sometimes dramatically — and the data looks like a rankings problem when it’s actually a SERP layout change.
GSC does not currently separate AI Overview impressions from standard organic impressions in the Performance report. There is a “Search Appearance” filter that may show some AI Overview data, but it’s inconsistent and doesn’t capture all instances.
What this means in practice: A sudden CTR drop across informational queries in 2026–2026 is more likely caused by AI Overview expansion than by a ranking decline. If your impressions are rising while clicks are flat, AI Overviews are a probable cause.
The workaround: Filter your GSC data by search appearance when possible. Cross-reference CTR trends with manual SERP checks for your target queries to see if AI Overviews are present. Focus reporting on clicks and click-based metrics rather than impression-based metrics for queries affected by AI Overviews.
14. BigQuery Bulk Data Export: The Unlimited Option (With Caveats)
BigQuery Bulk Data Export is the only method that removes the row limit entirely. When configured, Google ships your complete performance data to a BigQuery dataset every day — no row caps, no sampling beyond anonymized queries.
However, it has important caveats:
- Forward-only: It only captures data from the day you set it up. It cannot pull historical data, even data still within the 16-month retention window.
- Requires Google Cloud: You need a Google Cloud Platform project with the BigQuery API enabled. There are storage and query costs, though they’re minimal for most sites (a medium site generates roughly 100 MB per year).
- Anonymized queries are still hidden: The export includes a is_anonymized_query flag, but the actual query text is null for these rows. You get the clicks and impressions attributed to anonymized queries at the page level, but not the search terms.
- Requires aggregation: There is no guarantee that table rows are consolidated by date, URL, or query. You must use aggregation functions (GROUP BY) in your SQL queries to get accurate totals.
- Owner-only setup: Only verified property owners can configure the export. Users with lower permission levels cannot set it up.
What this means in practice: BigQuery Bulk Data Export is the best option available for comprehensive GSC data — but it requires technical setup and planning. If you haven’t enabled it yet, every day you wait is a day of data you’ll never have access to through this method.
The workaround: Set it up now, even if you don’t have immediate plans to query the data. The setup takes 15–20 minutes. Google’s official guide walks through the process step by step. The data accumulates silently in your BigQuery dataset, ready when you need it.
Frequently Asked Questions
Does Google Search Console limit keywords to the top 100 positions?
&num=100 parameter in late 2026, very few queries show position data beyond approximately 20, because real users rarely load that many results.